How to Design Engaging Infographics & Data Visualizations in Photoshop (with Pre-Built Elements)

Why Infographics Matter in Visual Storytelling
Statistics and data are powerful—but only when visualized effectively. A well-designed infographic not only communicates information, it makes that information memorable. It connects data with visual cues, enabling faster understanding and better retention.
Yet many creators struggle with this step. Raw numbers without structure or design are often ignored, misunderstood, or worse—completely forgotten.
This guide will walk you through how to design engaging infographic visuals in Photoshop, using both manual techniques and pre-built elements to speed up your workflow. Whether you’re a designer, marketer, or content creator, you’ll learn how to design infographics in Photoshop that are visually stunning and structurally sound.
Professional Photoshop Templates
Why Use Photoshop for Infographic Design?
Why Photoshop Stands Out:
- Pixel-Perfect Control: Unlike many drag-and-drop tools, Photoshop gives you full control over every pixel, which is critical for aligning grids, manipulating assets, or customizing every aspect of your infographic layout.
- Layer-Based Editing: Each element—text, icons, backgrounds, data charts—can be isolated and styled individually. This makes your editing process non-destructive and ultra-flexible.
- Smart Objects & Filters: Reusable elements, scalable vector assets, and editable filters enable a fast, professional workflow.
When Photoshop Outperforms Other Tools:
- Need ultra-custom visuals not available in templates? Go Photoshop.
- Want to create infographic elements that integrate into broader design systems or marketing materials? Use Photoshop.
- Creating content for high-res or print? Photoshop’s control over color profiles and DPI is unbeatable.
Whether you’re looking to build from scratch or follow a structured process, a Photoshop infographic tutorial like this one will equip you to produce assets that are not only functional, but beautiful.
Essential Elements of an Engaging Infographic
Here are the core elements you should always include:
1. A Clear Visual Structure
Break your infographic into distinct parts:
- Intro: Introduce the subject and value.
- Body: Present the key data points and insights.
- Conclusion: Wrap up with a summary or takeaway.
2. Typography & Visual Hierarchy
Good design guides the eye. Use font size, weight, and spacing to:
- Emphasize key stats
- Group related items
- Ensure easy readability across all devices
3. Color Consistency
Use a harmonious color palette to:
- Differentiate categories of information
- Direct attention where needed
- Maintain brand consistency
4. Icons & Data Styling
Stylize your charts, graphs, and icons:
- Use simplified, clean visuals that complement your data
- Avoid overly detailed or stock-style icons that dilute clarity
5. Accessibility & Simplicity
- Use large, legible fonts
- Maintain high contrast for colorblind accessibility
- Don’t overcrowd sections—less is more
By incorporating these principles, you’re not only creating better visual content—you’re also optimizing infographics for SEO in Photoshop. Clean, accessible, and lightweight designs perform better in search, especially when paired with proper image metadata and filenames.
Step-by-Step: Designing Infographics in Photoshop
A. Set Up Your Canvas
Start by choosing dimensions based on your publishing platform:
- For Web: 800px to 1200px wide, height as needed (keep it scrollable)
- For Print: A4 (2480 x 3508px at 300dpi) or custom dimensions for posters or flyers
Use RGB for screen and CMYK for print projects.
B. Use Guides and Grids
Use Photoshop’s rulers and grid system (View > Rulers / New Guide Layout) to:
- Maintain column consistency
- Align icons, text blocks, and charts perfectly
- Keep margins and padding uniform
C. Add Visual Elements
Add the core building blocks of your infographic:
- Icons & illustrations for representing data types
- Vector shapes for backgrounds and dividers
- Graphs & charts, either drawn manually or imported
💡 Want ready-made elements to speed things up?
Download pre-built infographic templates here. Professionally designed elements save hours of work and elevate your visual storytelling.
D. Integrate Data Visualizations
You have two main approaches:
- Manual Shapes: Draw bar charts, pie segments, or lines with the Shape Tool. Add value labels manually.
- Smart Objects: Use editable graph mockups where data can be replaced easily without redrawing.
Use layer styles (shadows, gradients, strokes) to enhance clarity and give visual weight to important elements.
E. Export for Web or Print
Once complete, export your infographic based on where it will be used:
- Web:
- Export as JPG or PNG-24
- Use Save for Web (File > Export > Save for Web)
- Compress using tools like TinyPNG or ImageOptim
- Print:
- Export as high-resolution PDF or TIFF
- Ensure 300 DPI and proper bleed/margin settings
Use descriptive file names (e.g., infographic-design-photoshop-template.png) and add alt text with keywords like “Photoshop infographic template on data visualization.” This helps SEO and image discovery.
Power Up with Pre-Built Infographic Templates
Why Use Pre-Built Templates?
- ✅ Save Time: Skip the setup and jump straight into customization
- ✅ Professional Quality: Templates are usually designed by experts with layout, spacing, and balance already considered
- ✅ Creative Inspiration: Even if you modify them, templates spark design direction and structure
What to Look for in a Quality Photoshop Infographic Template:
- Layered PSD Files: Make sure all elements are separated and easy to edit
- Editable Text Fields: You should be able to update fonts, values, and labels with ease
- Vector Shapes & Icons: To maintain resolution and allow resizing without distortion
- Smart Objects: For easy replacement and styling
- Modular Sections: So you can mix, match, and build longer or shorter layouts
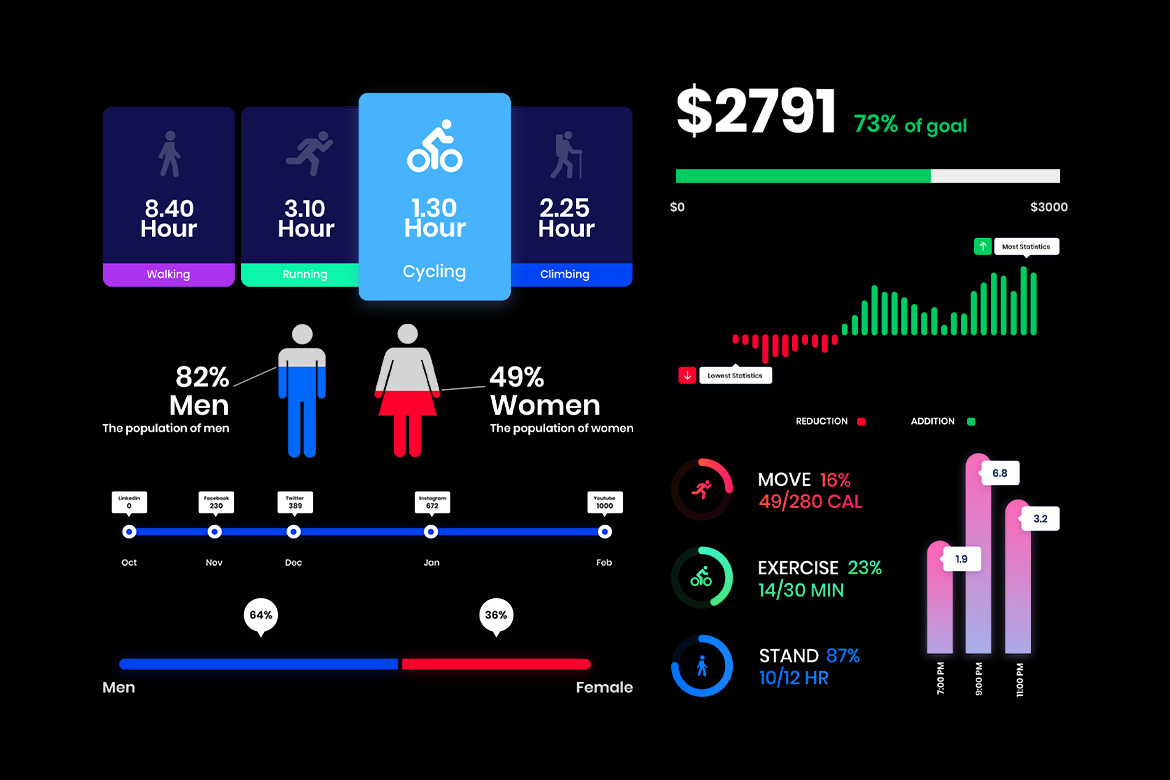
🚀 Upgrade your workflow with Pixflow’s Photoshop HUDs & Infographic Templates. Professionally designed and fully customizable, they’re ideal for data storytelling, UI dashboards, marketing reports, and more.
Pro Design Tips for Better Results
1. Use Contrast & Whitespace Strategically
Don’t underestimate the power of breathing room. Use whitespace to group elements and make sections more readable. High contrast between background and text ensures legibility on all screens.
2. Avoid Over-Cluttering
The most common mistake in infographic design? Too much information. Stick to your core message and only include visuals that support it. Less truly is more.
3. Tell a Visual Story
Think beyond charts. Use icons, color changes, and layout progression to create a narrative flow. Good data visualization isn’t just about accuracy—it’s about clarity and emotion.
4. Add Subtle Animations (for Web Use)
Export sections as individual frames or use video layers in Photoshop to animate key elements for web or social use. Movement draws attention without overwhelming the viewer.
5. Keep Versioned PSDs
Always duplicate your .PSD files before major edits. Versioning protects you from errors and lets you explore creative options without committing too early.
By applying these tips for designing engaging infographics with Photoshop, you’ll consistently create visuals that inform, impress, and perform.
Conclusion
Whether you prefer to start from scratch or boost your speed with templates, this guide equips you to design data-rich, visually stunning assets that resonate with your audience. With practice and the right resources, you’ll gain the confidence to visualize complex information effortlessly.
Don’t forget—if you’re looking to fast-track your workflow with high-quality, pre-designed assets, check out the Pixflow HUDs & Infographic Templates for Photoshop. They’re the perfect foundation for any data visualization project.
Disclaimer : If you buy something through our links, we may earn an affiliate commission or have a sponsored relationship with the brand, at no cost to you. We recommend only products we genuinely like. Thank you so much.


