Video Templates
Video Packs
Graphic Packs
Plugins
in Video Templates
in Graphic Templates
in Video Packs
in Graphic Packs
in
Articles
Browse All
Industry News
Filmmaking
Video Editing
Color Grading
Creative AI
Motion Design
Graphic Design
Premiere Template
After Effects Template
Plugins
Articles
Browse All
Industry News
Filmmaking
Video Editing
Color Grading
Creative AI
Motion Design
Graphic Design
Premiere Template
After Effects Template
Plugins
Daily Tips, Templates, and Industry News for After Effects & Premiere Pro Users.
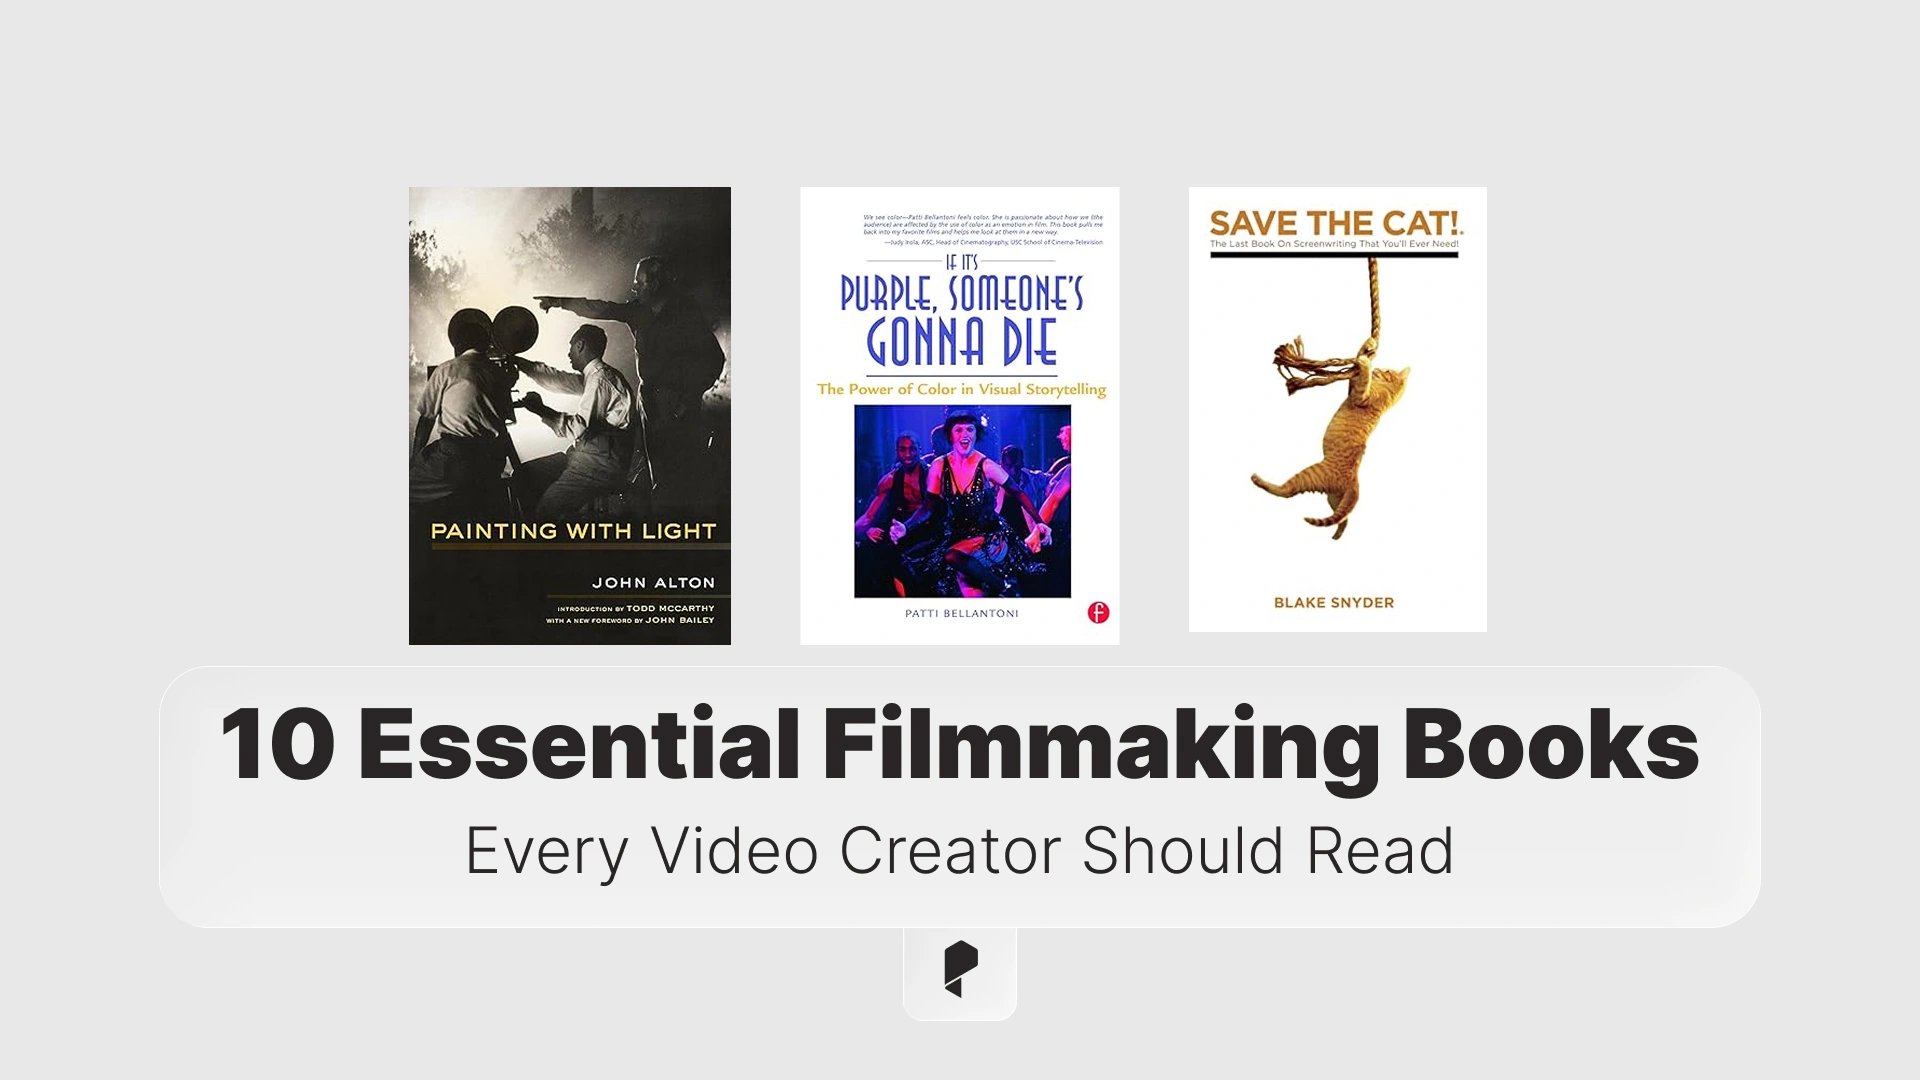
10 Essential Filmmaking Books Every Video Creator Should Read
31 Dec,2025
Featured
9 Minutes
Effortless AI Voiceovers: A Guide to Using the Pixflow Plugin in After Effects & Premiere Pro
11 May,2025
After Effects
6 Minutes
The Ultimate Guide to Film Credits: Examples, Templates, and Best Practices for 2025
12 Mar,2026
Featured
15 Minutes
Top 7 Motion Design Trends of 2025
10 Mar,2025
Featured
6 Minutes
Most recent
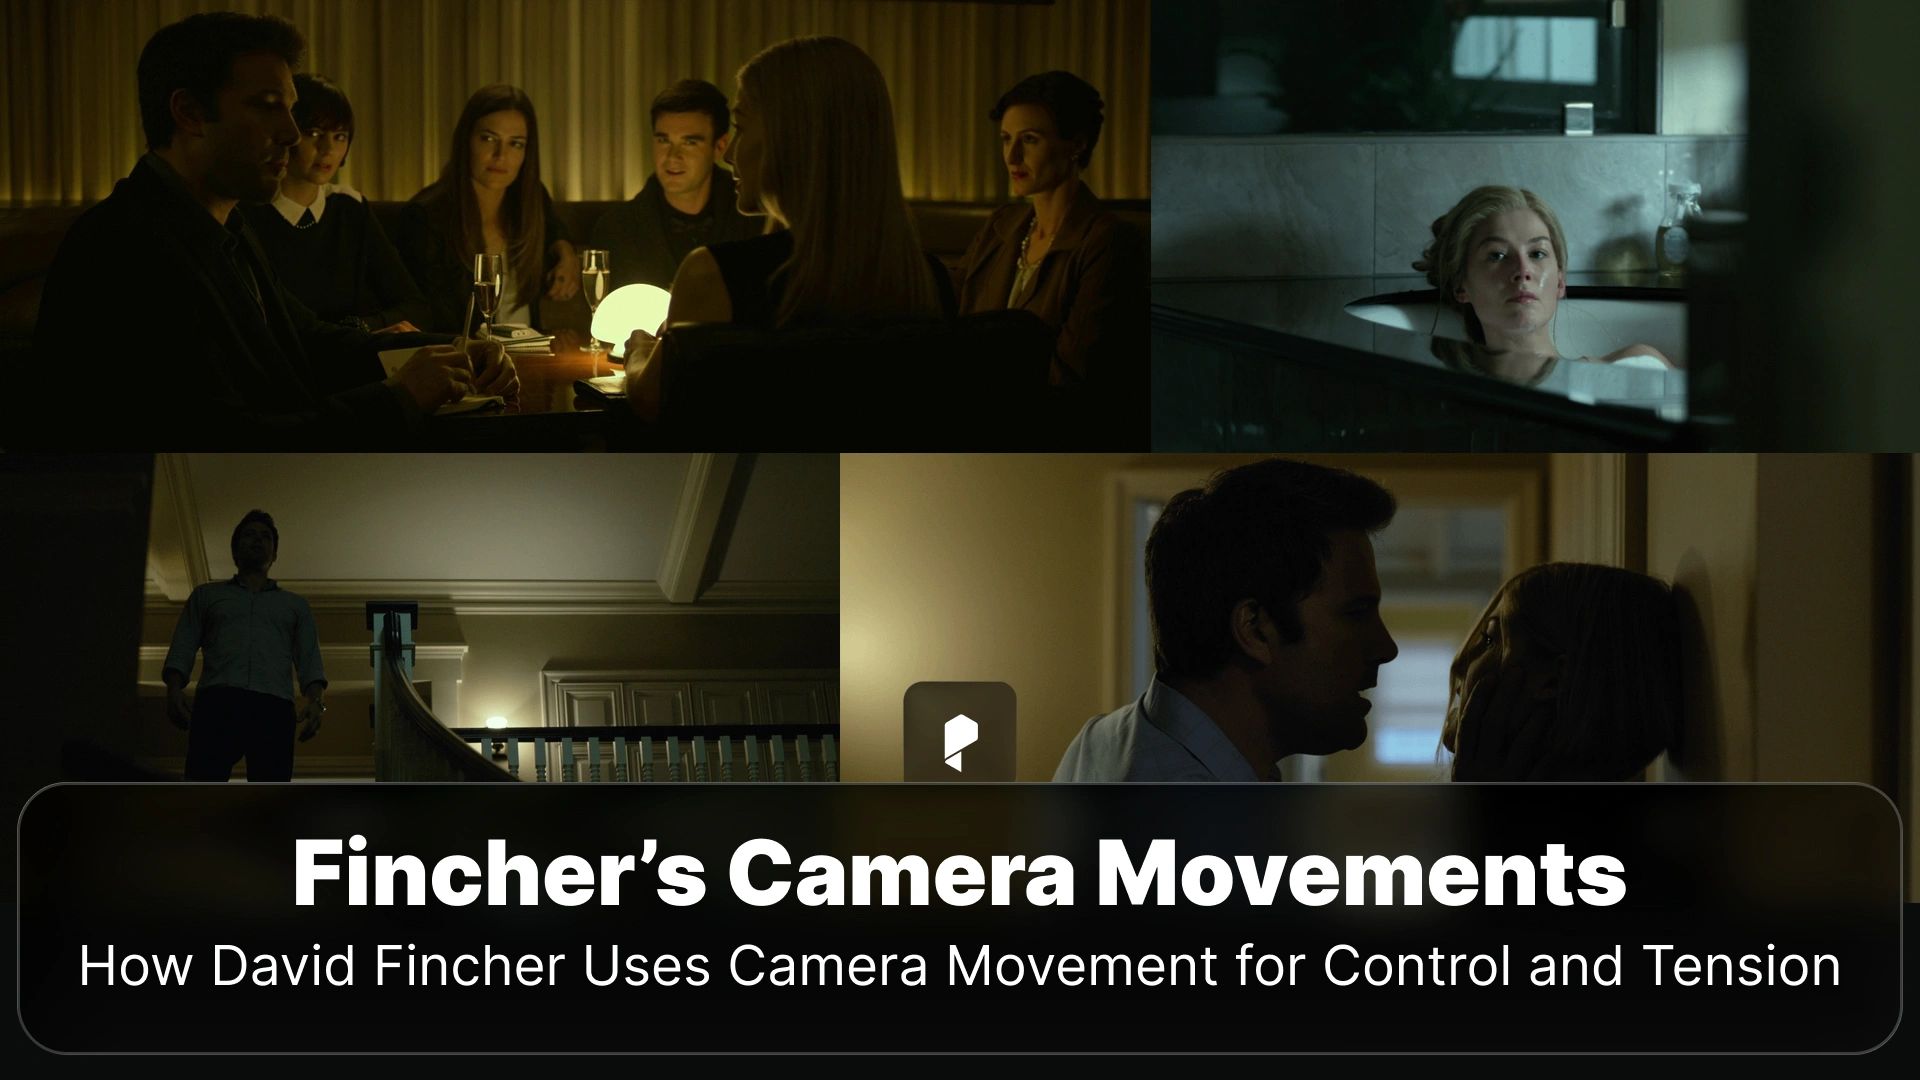
How David Fincher Uses Camera Movement for Control and Tension
12 Mar,2026
Filmmaking
7 Minutes
Remote Design Tools That Boost Creativity in 2026
15 Mar,2026
Tips & Tricks
4 Minutes
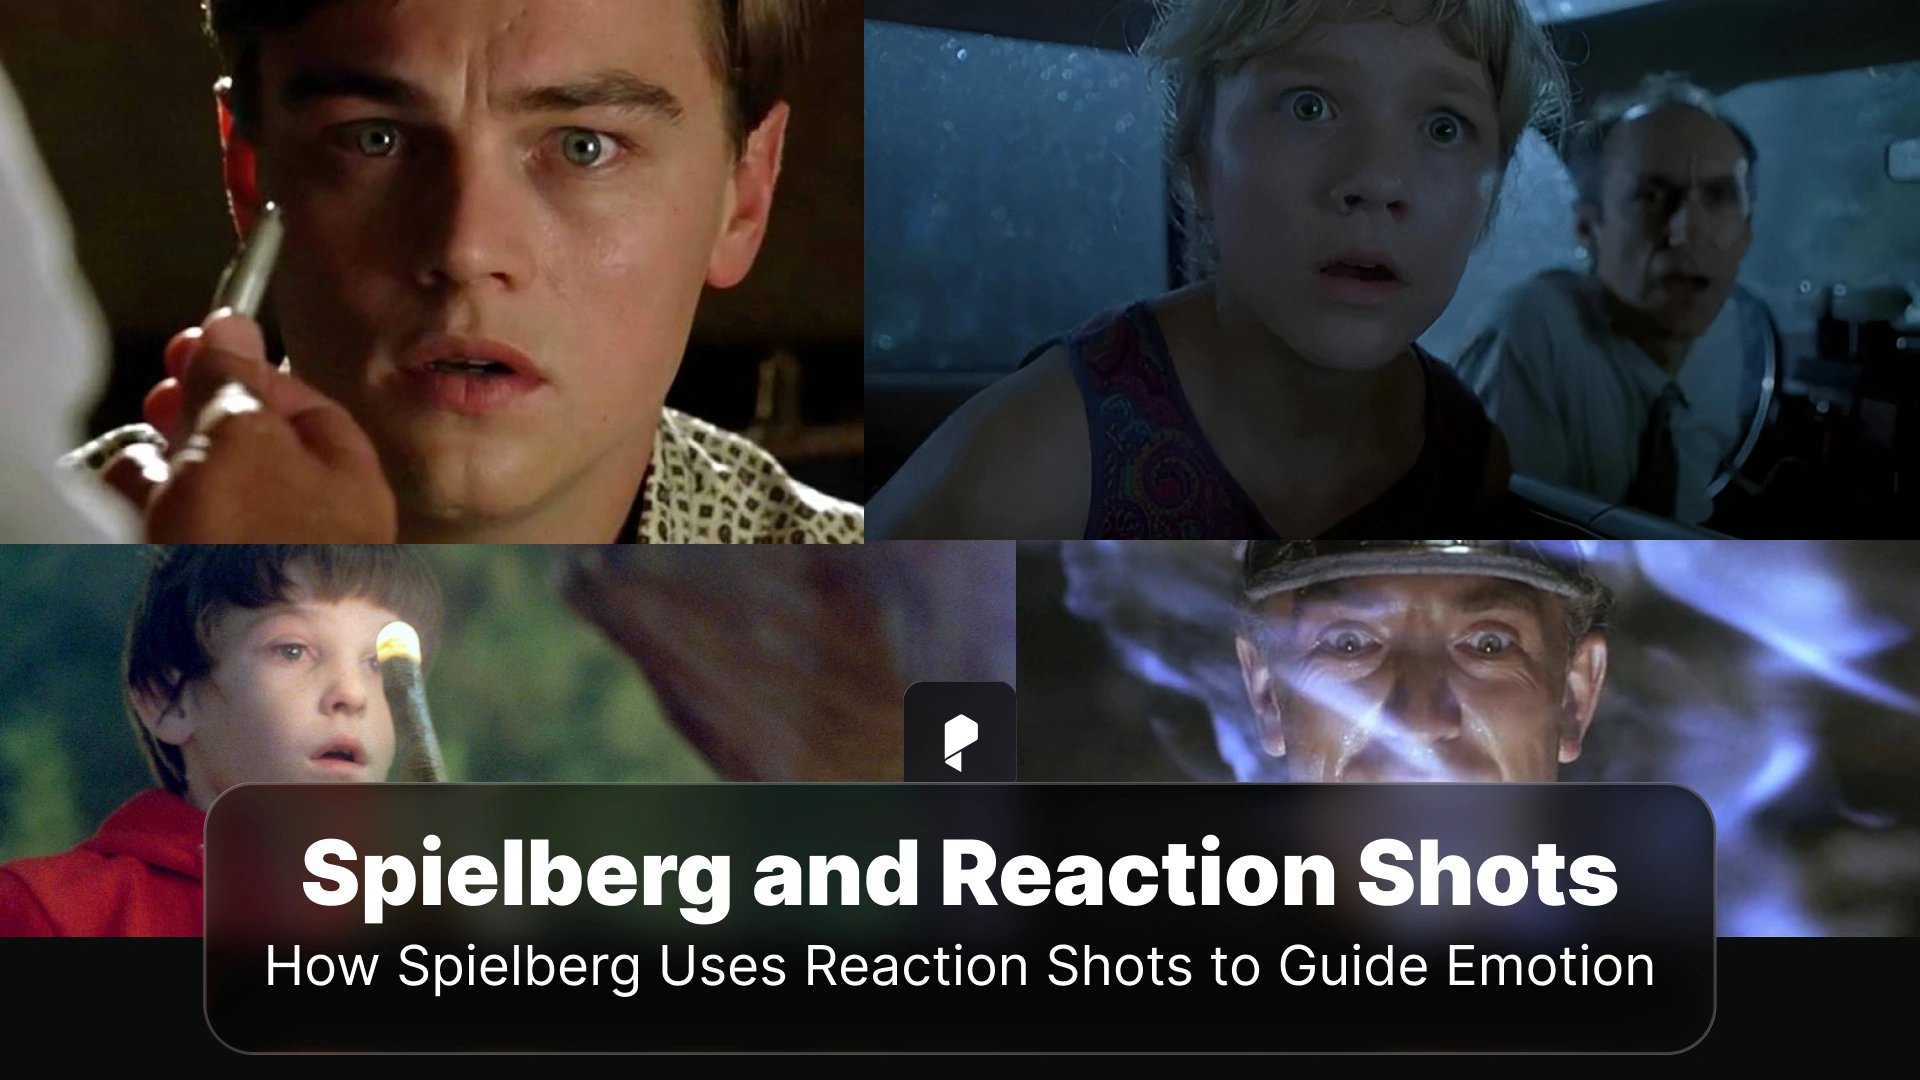
How Spielberg Uses Reaction Shots to Guide Emotion
11 Mar,2026
Filmmaking
7 Minutes
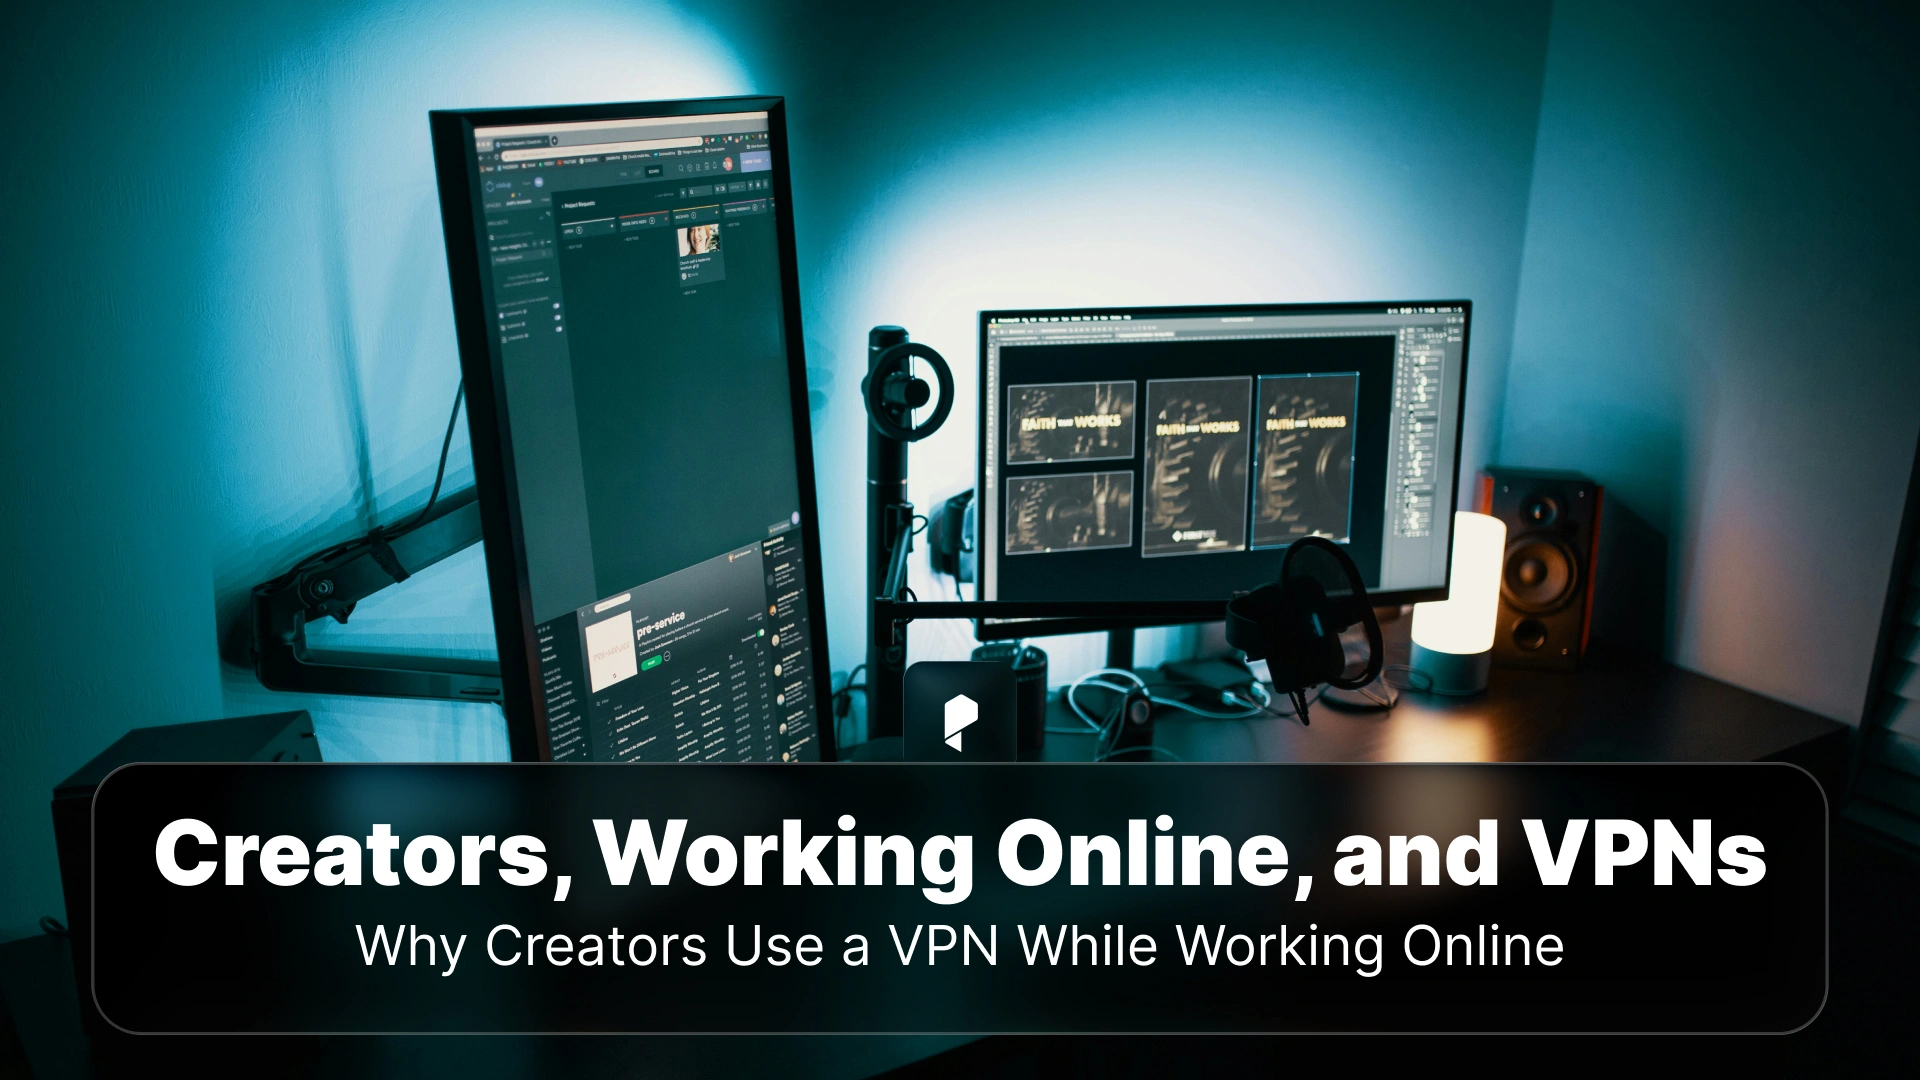
Why Designers and Creators Should Use a VPN While Working Online
12 Mar,2026
Tips & Tricks
4 Minutes
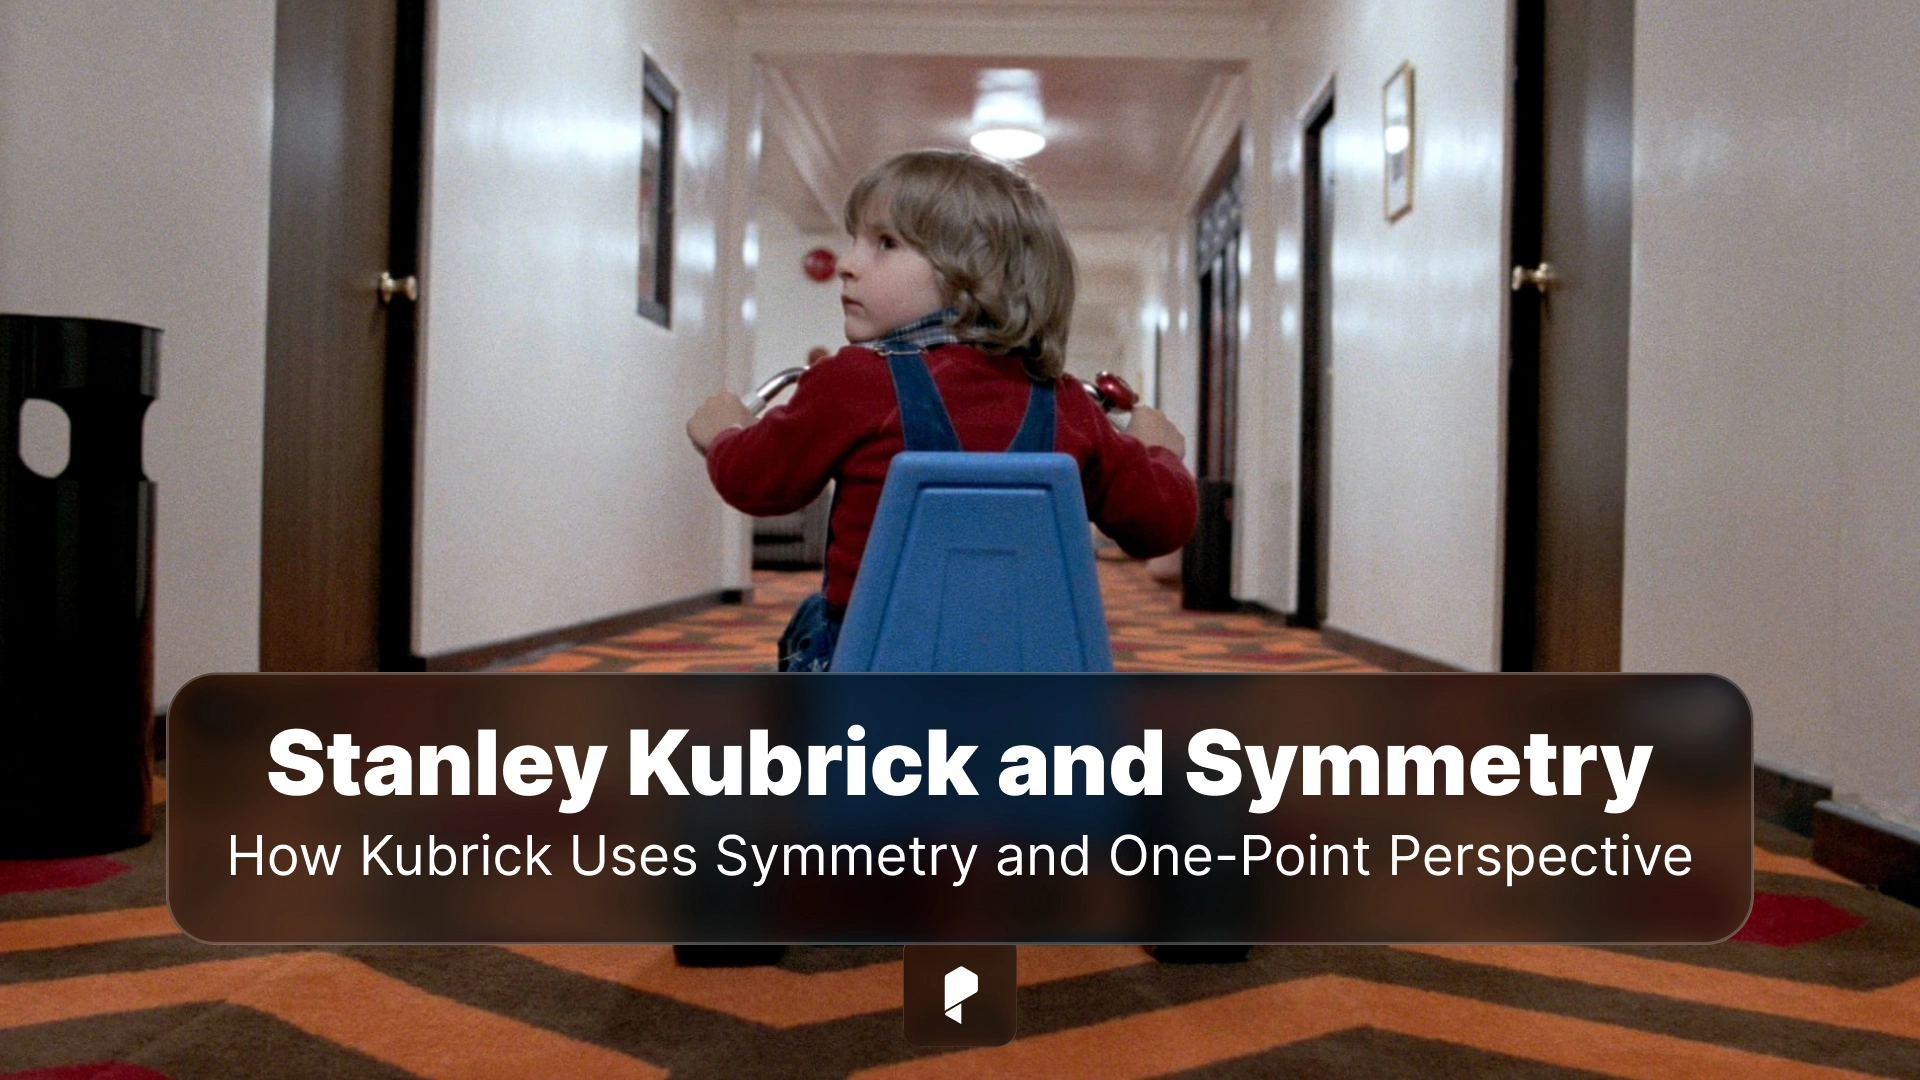
How Stanley Kubrick Uses Symmetry and One-Point Perspective
11 Mar,2026
Filmmaking
8 Minutes
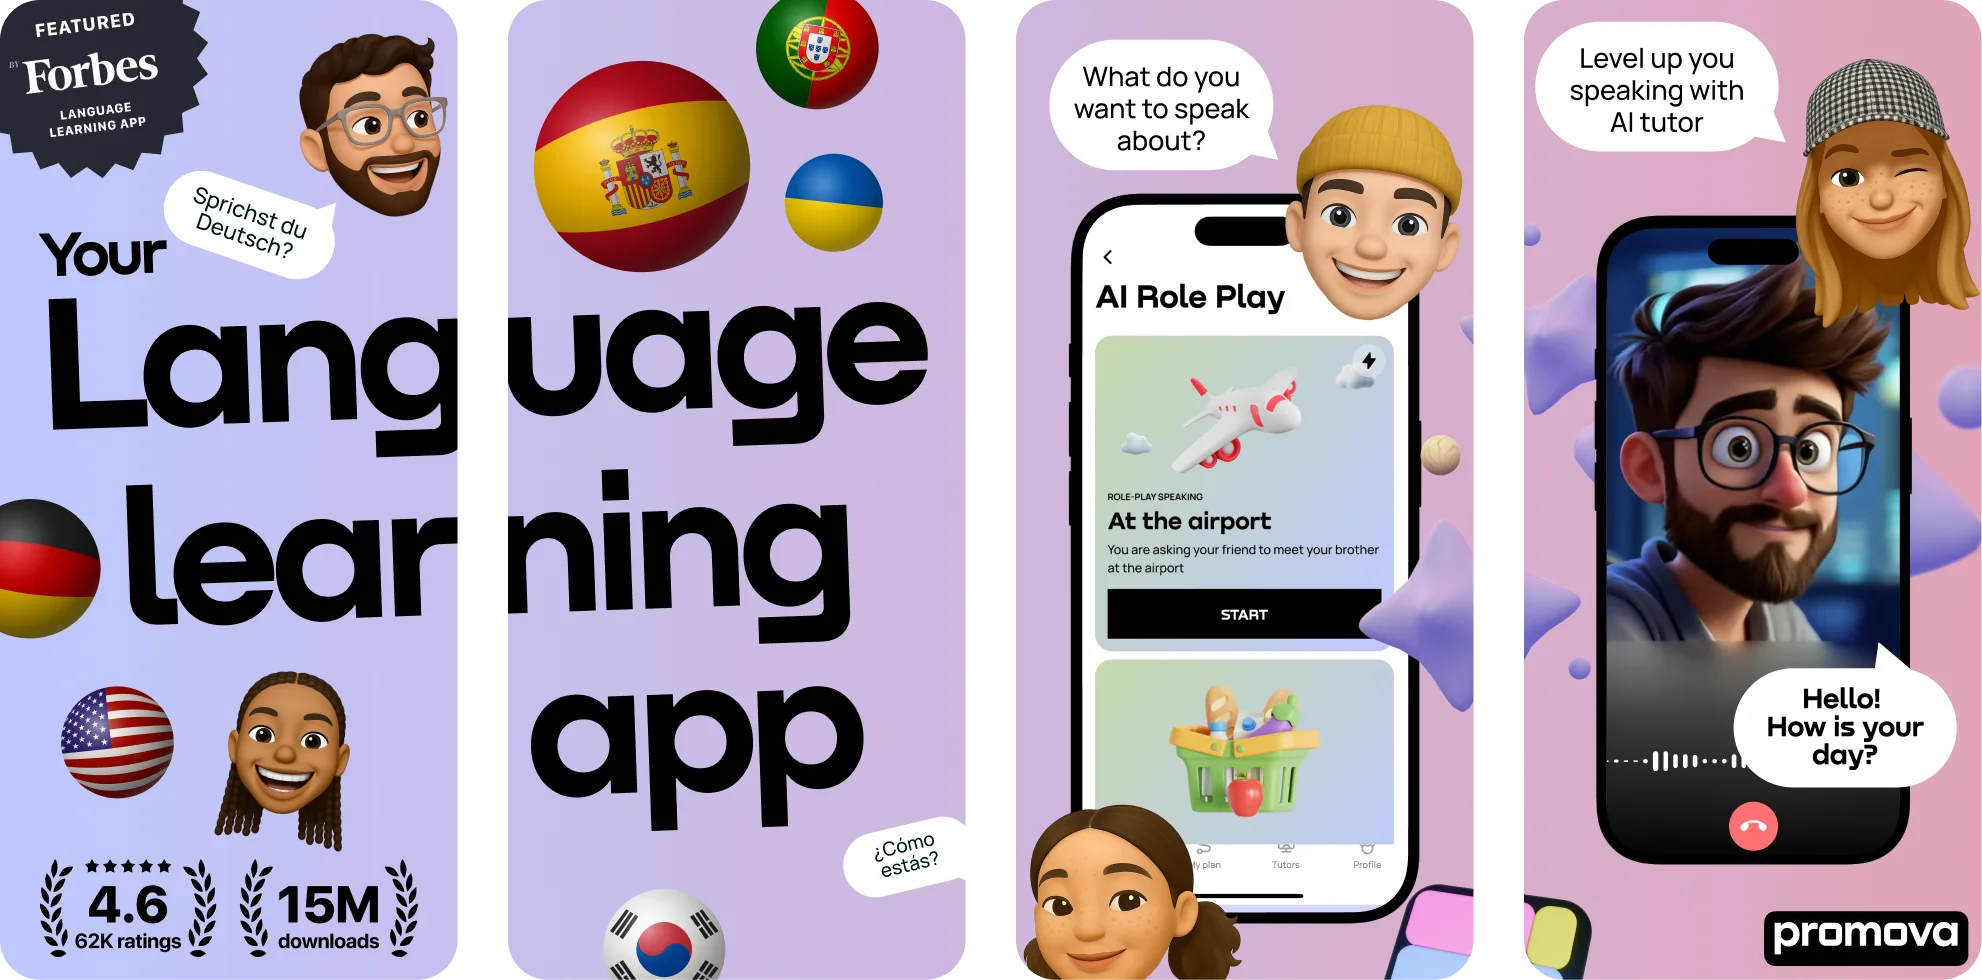
7 Language Learning Apps for Content Creators Working with International Clients and Multilingual Audiences
05 Mar,2026
Tips & Tricks
4 Minutes
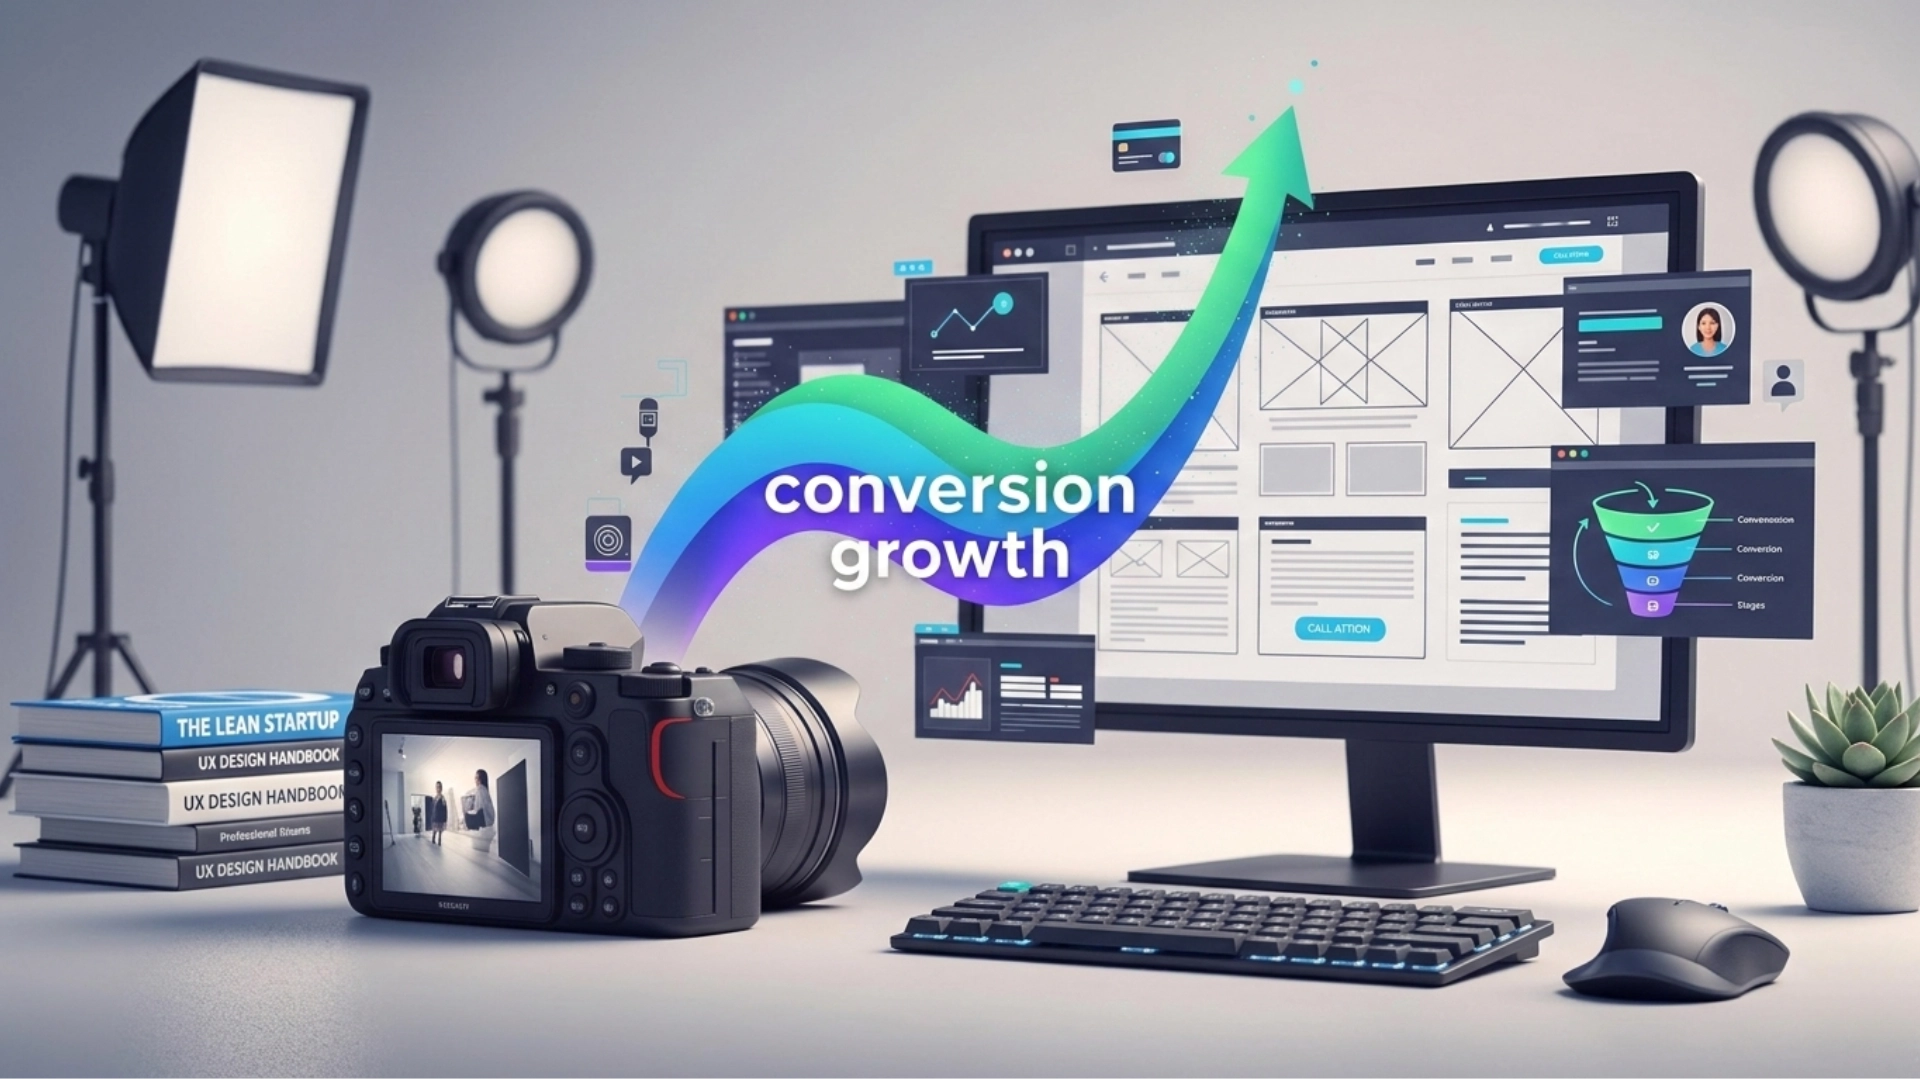
How Strategic Video Placement Turns Your Website Into a Conversion Engine
04 Mar,2026
Tips & Tricks
4 Minutes
Designing Interactive Experiences for Retail & CPG Brands
16 Feb,2026
Tips & Tricks
4 Minutes
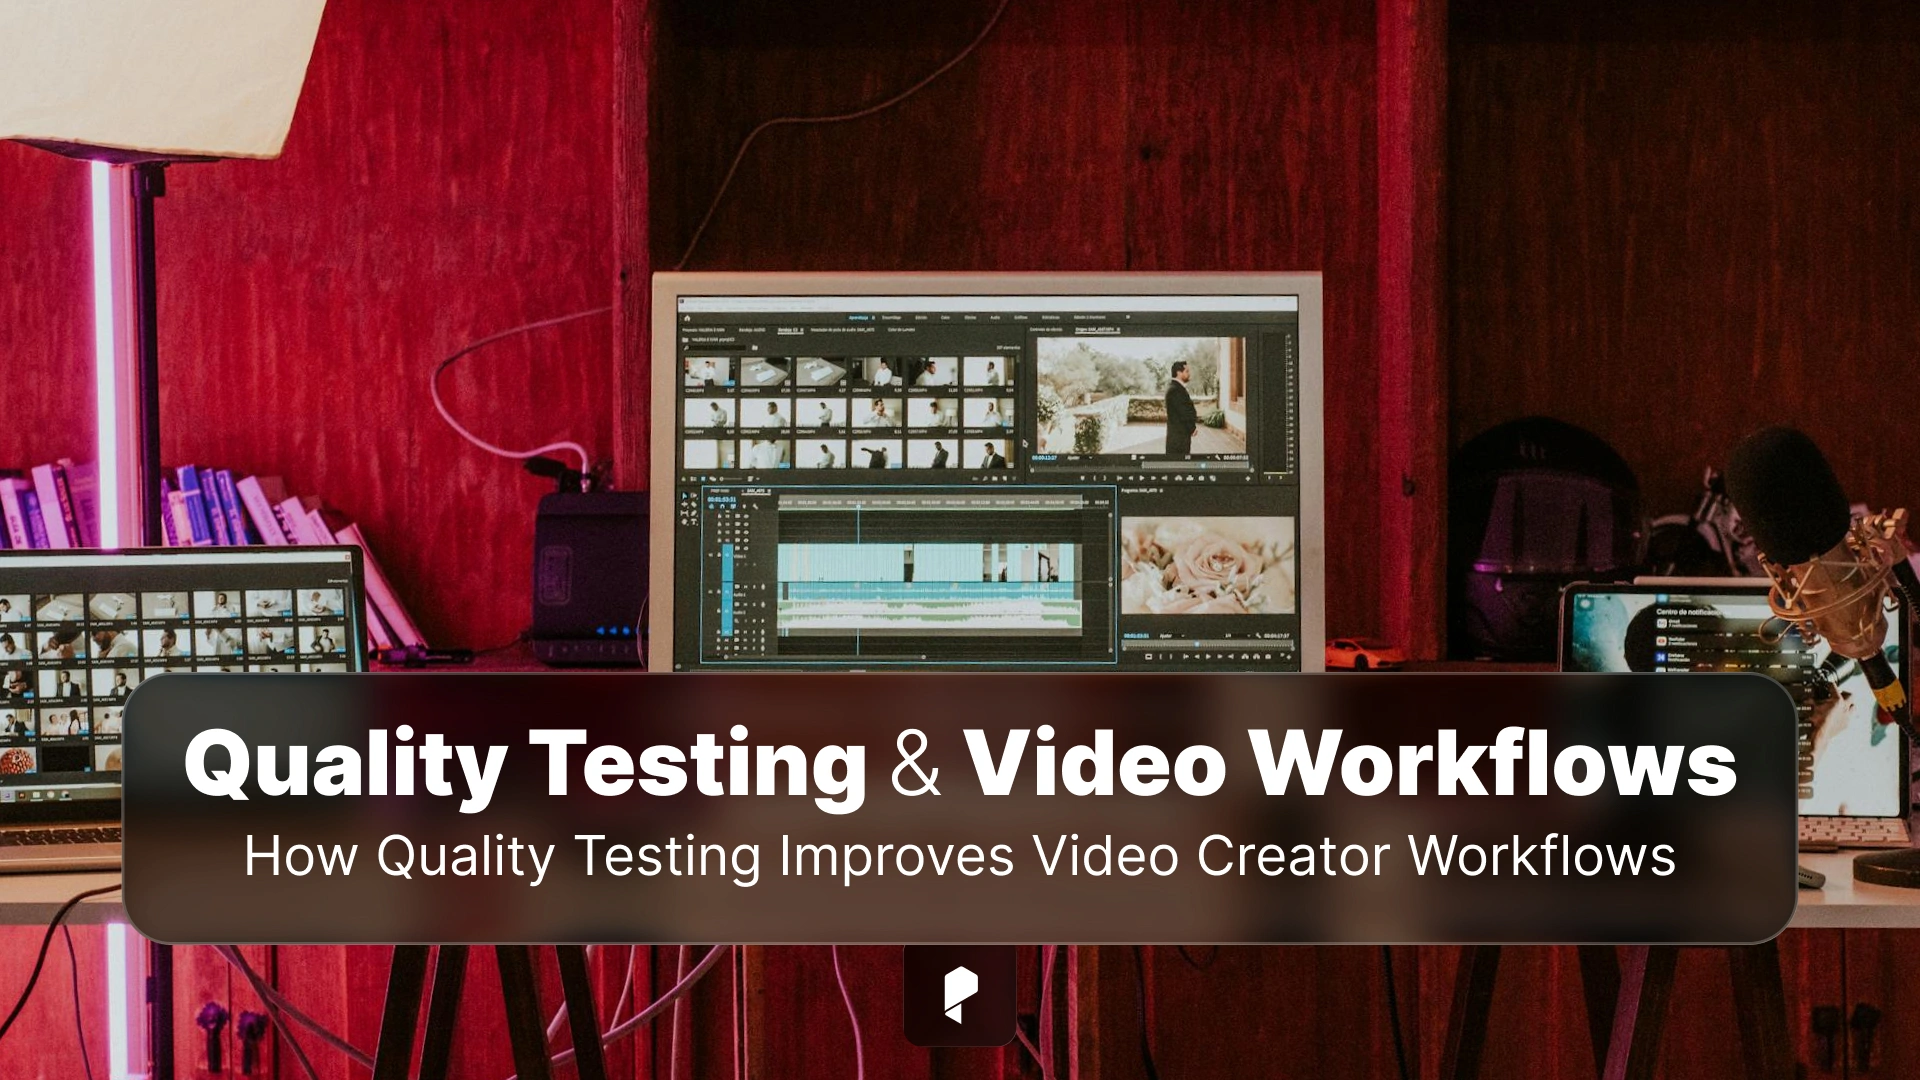
Behind the Scenes: How Quality Testing Improves Video Creator Workflows
16 Feb,2026
Tips & Tricks
5 Minutes
The 5 Best Places to Outsource Wedding Video Editing
08 Mar,2026
Tips & Tricks
3 Minutes
Performance Matters: How VPS Hosting Improves Readability of News Platforms
16 Feb,2026
Tips & Tricks
3 Minutes
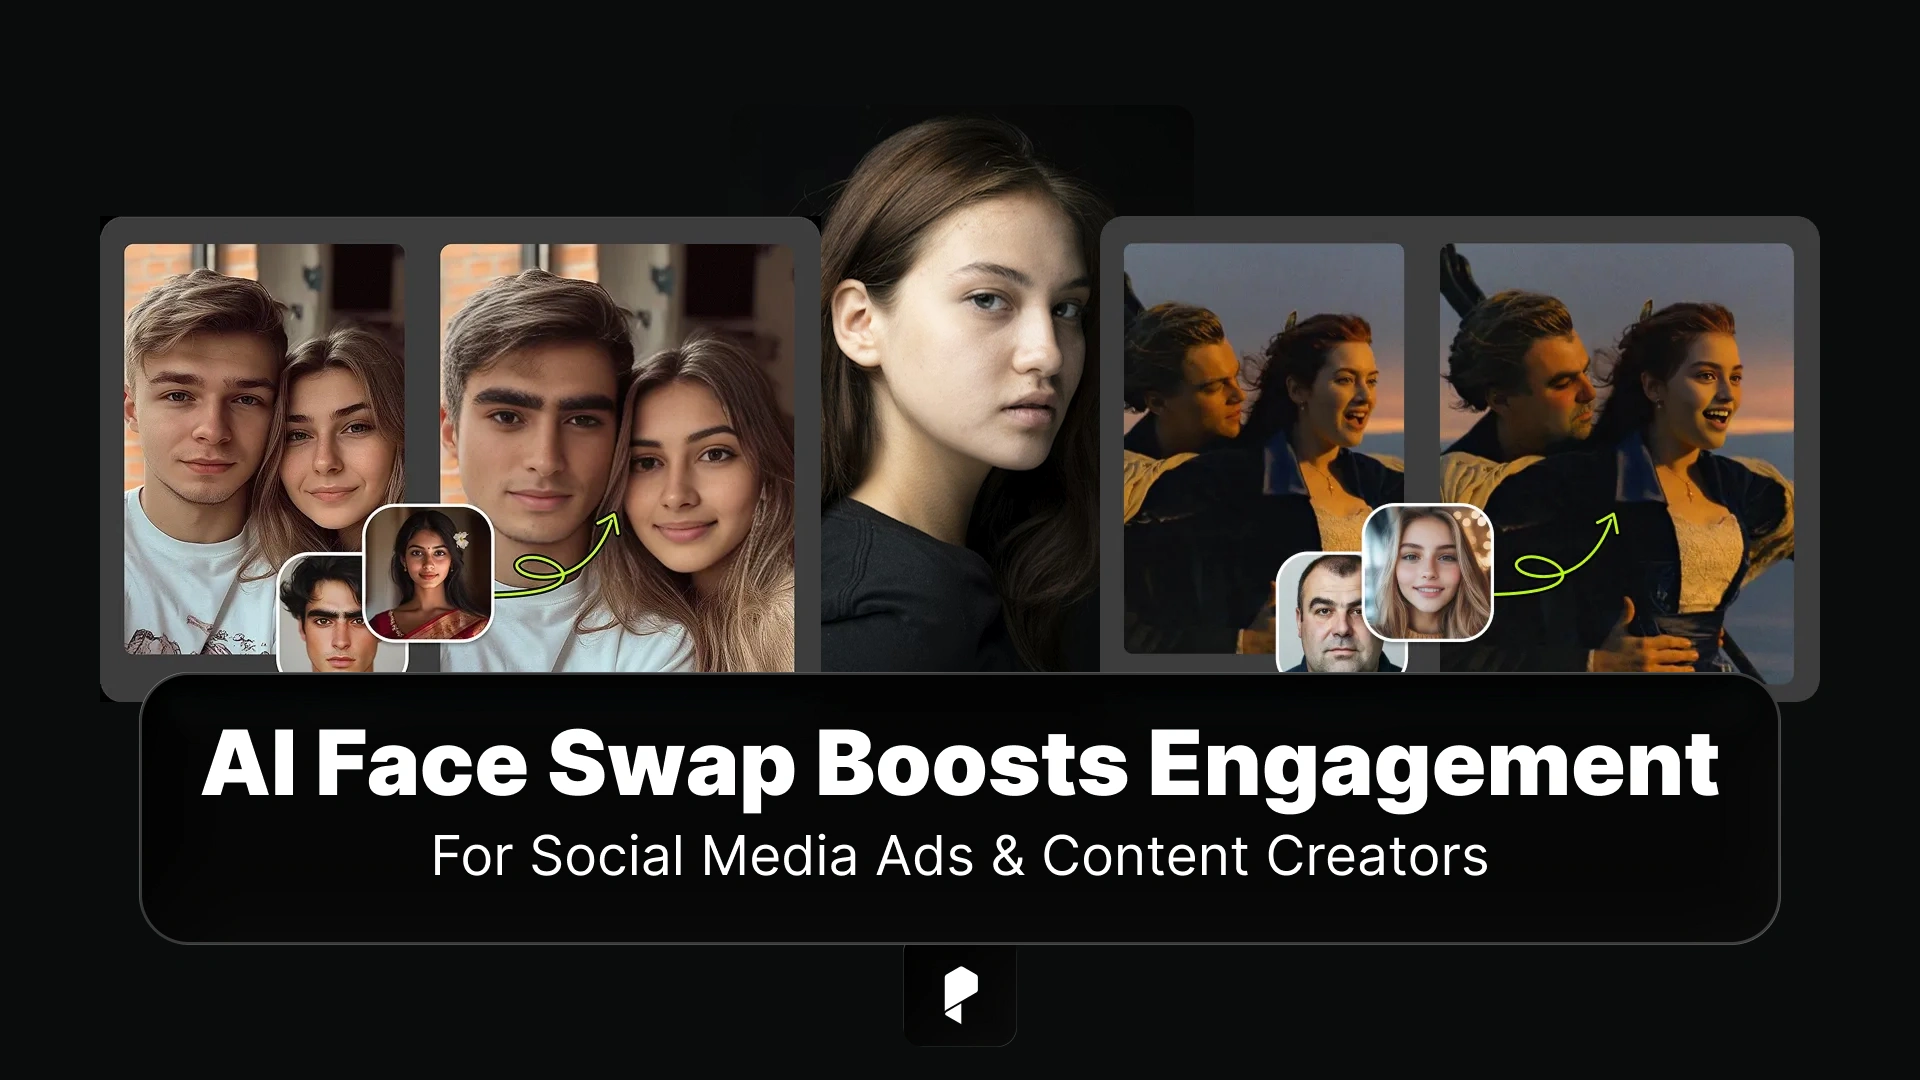
Enhancing Social Media Ads: How AI Face Swap Boosts Engagement for Content Creators
12 Feb,2026
Creative AI
6 Minutes
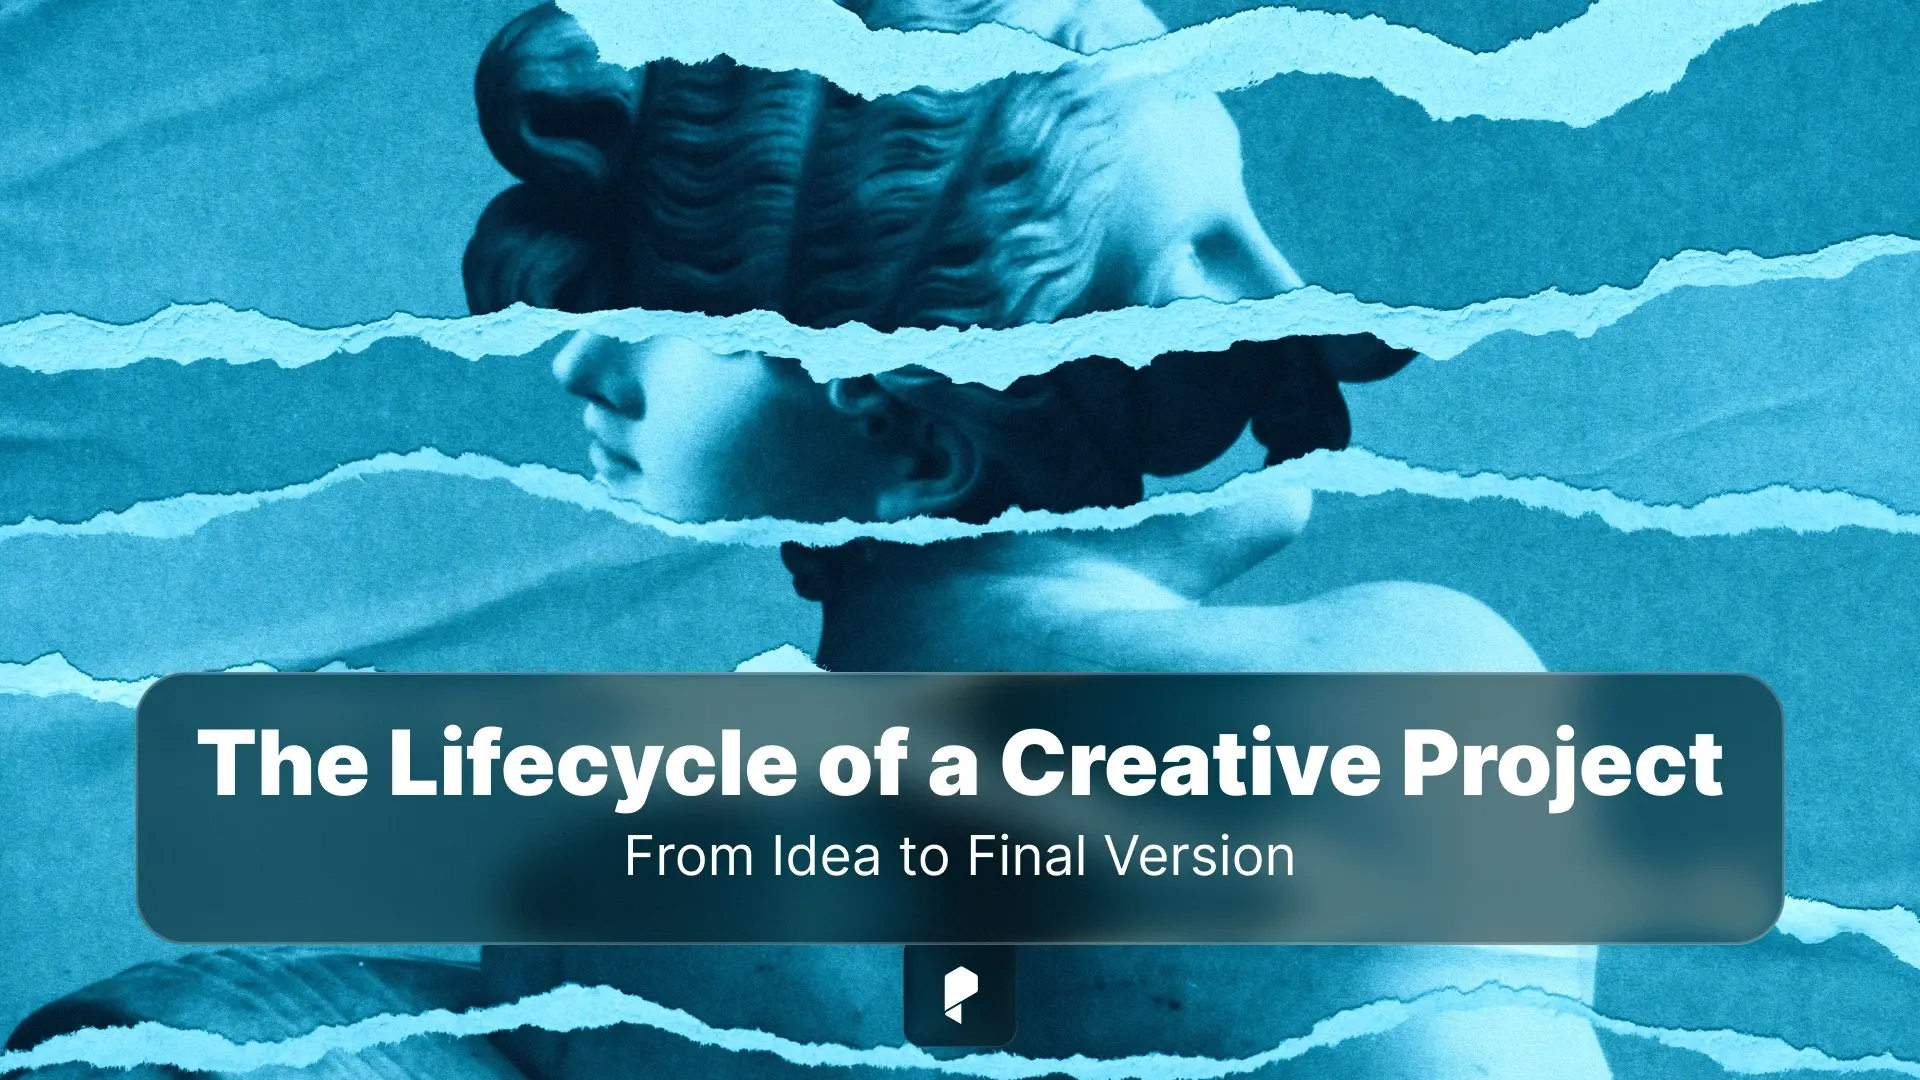
From Idea to Final Version: Managing the Lifecycle of a Creative Project
08 Feb,2026
Tips & Tricks
4 Minutes
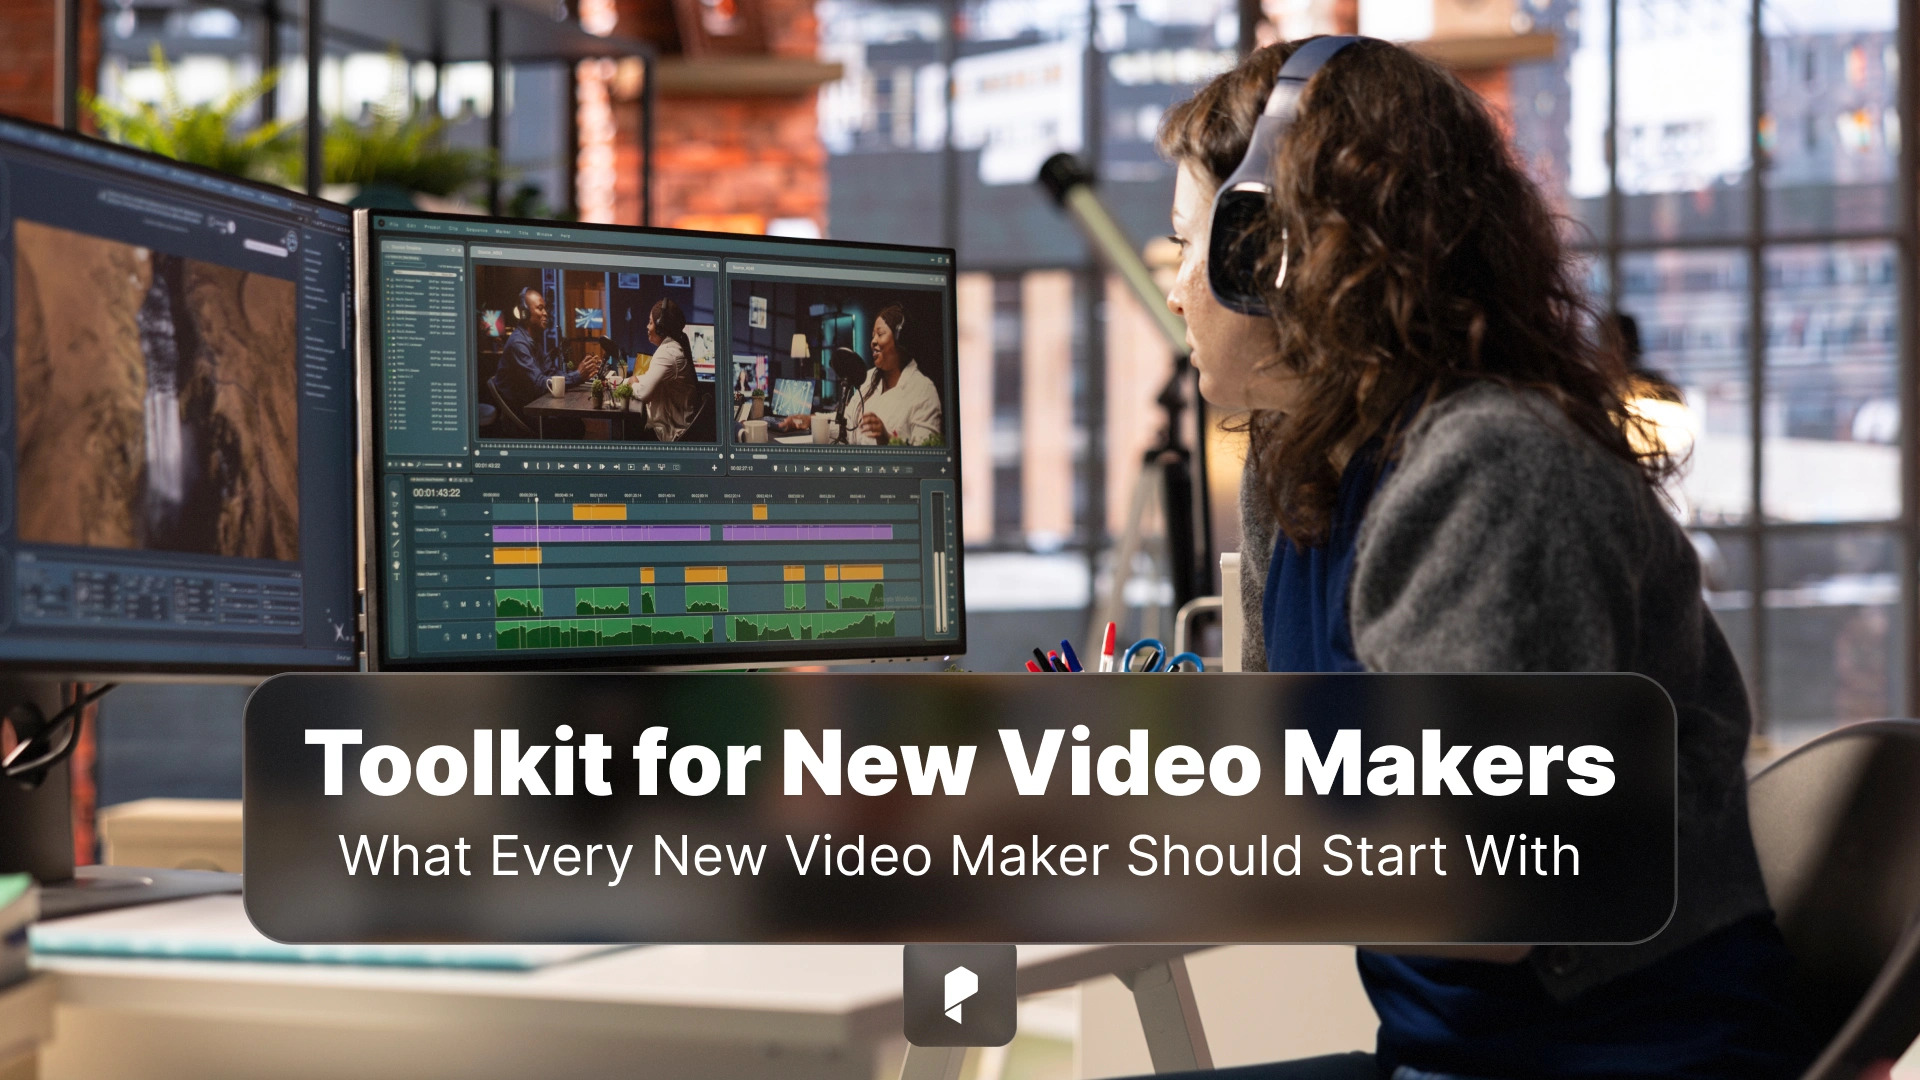
Beginner’s Toolkit: What Every New Video Maker Should Start With
03 Feb,2026
Video Editing
5 Minutes
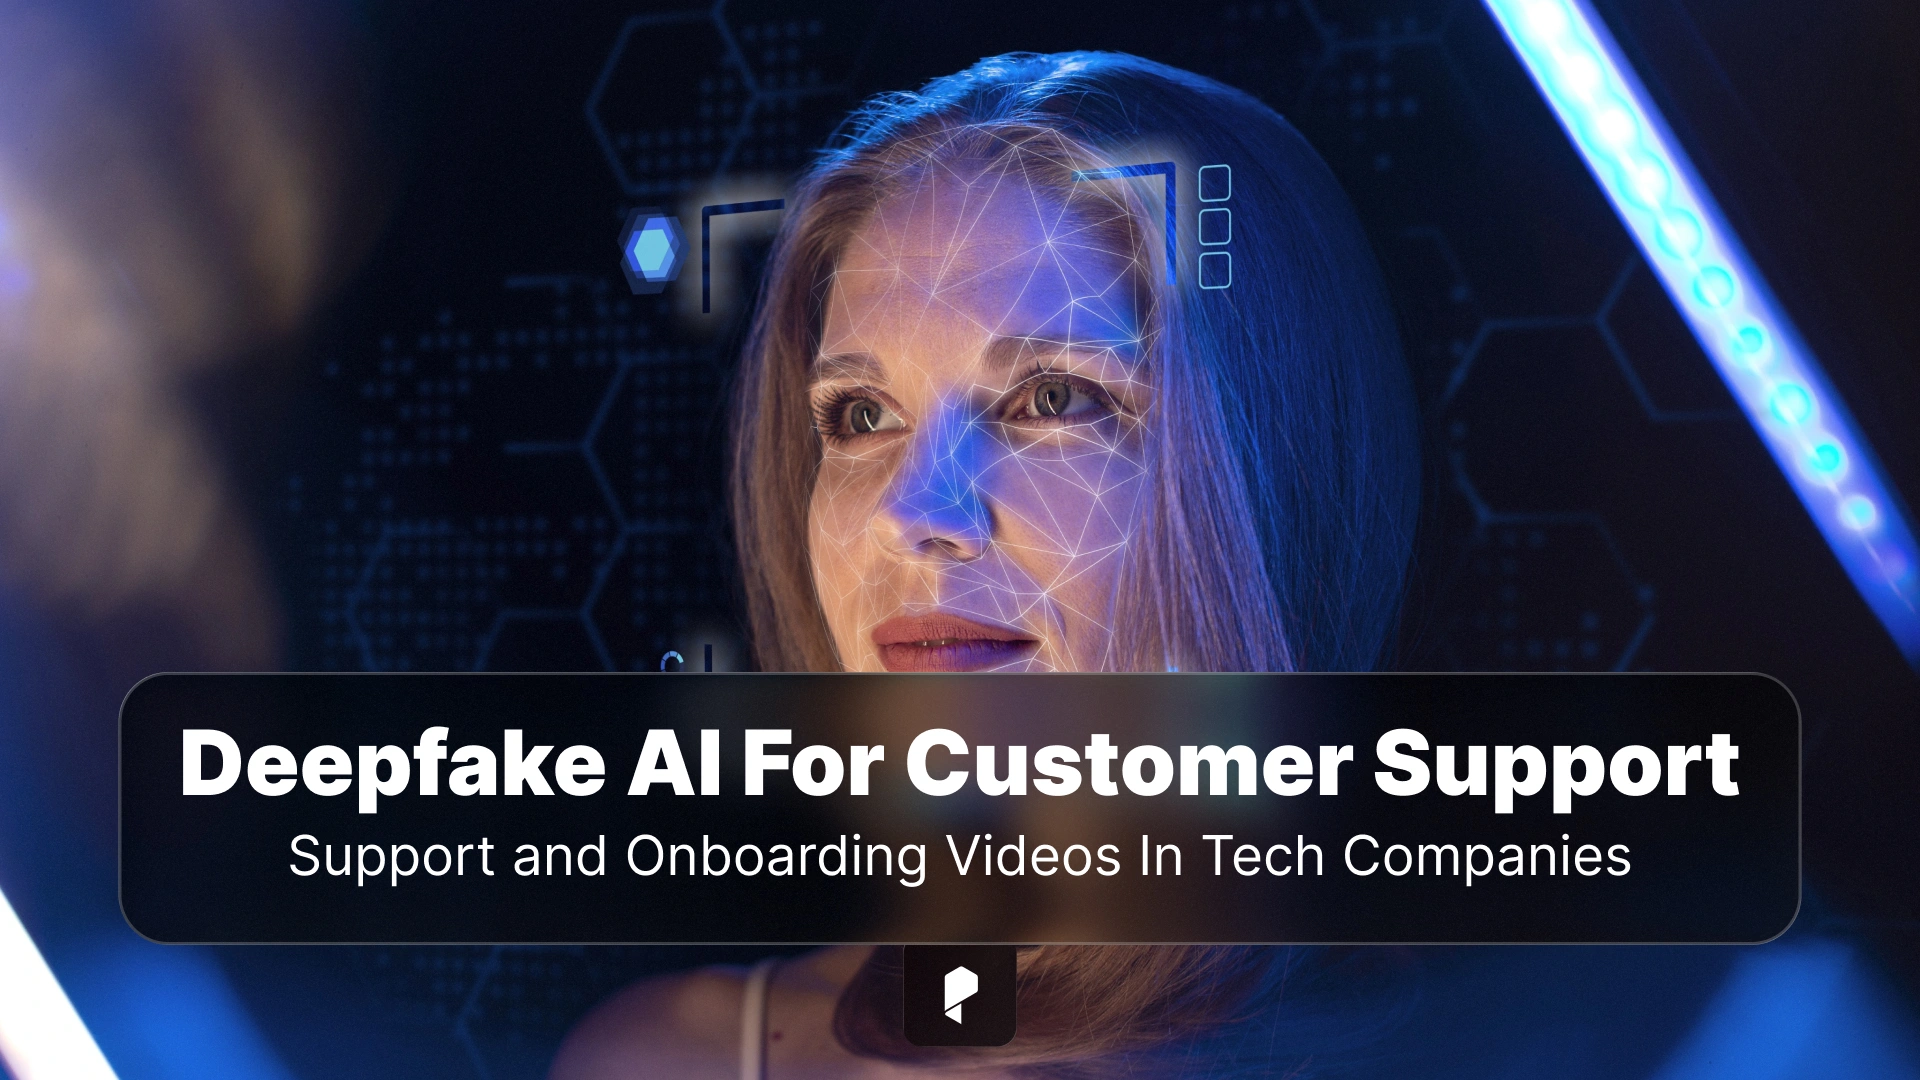
5 Benefits Of Deepfake AI For Customer Support And Onboarding Videos In Tech Companies
03 Feb,2026
Creative AI
5 Minutes
5 Key Features to Look for in an AI Companion App in 2026
03 Feb,2026
Creative AI
7 Minutes
Why Pixel-Perfect UI Often Requires Customization, Not Templates
03 Feb,2026
Tips & Tricks
7 Minutes
Desk Setup Essentials for Video Editing: The Creator Workstation Checklist
29 Dec,2025
Tips & Tricks
7 Minutes
Analyzing Blade Runner 2049’s Cinematography: How to Recreate the Look
29 Dec,2025
Filmmaking
7 Minutes
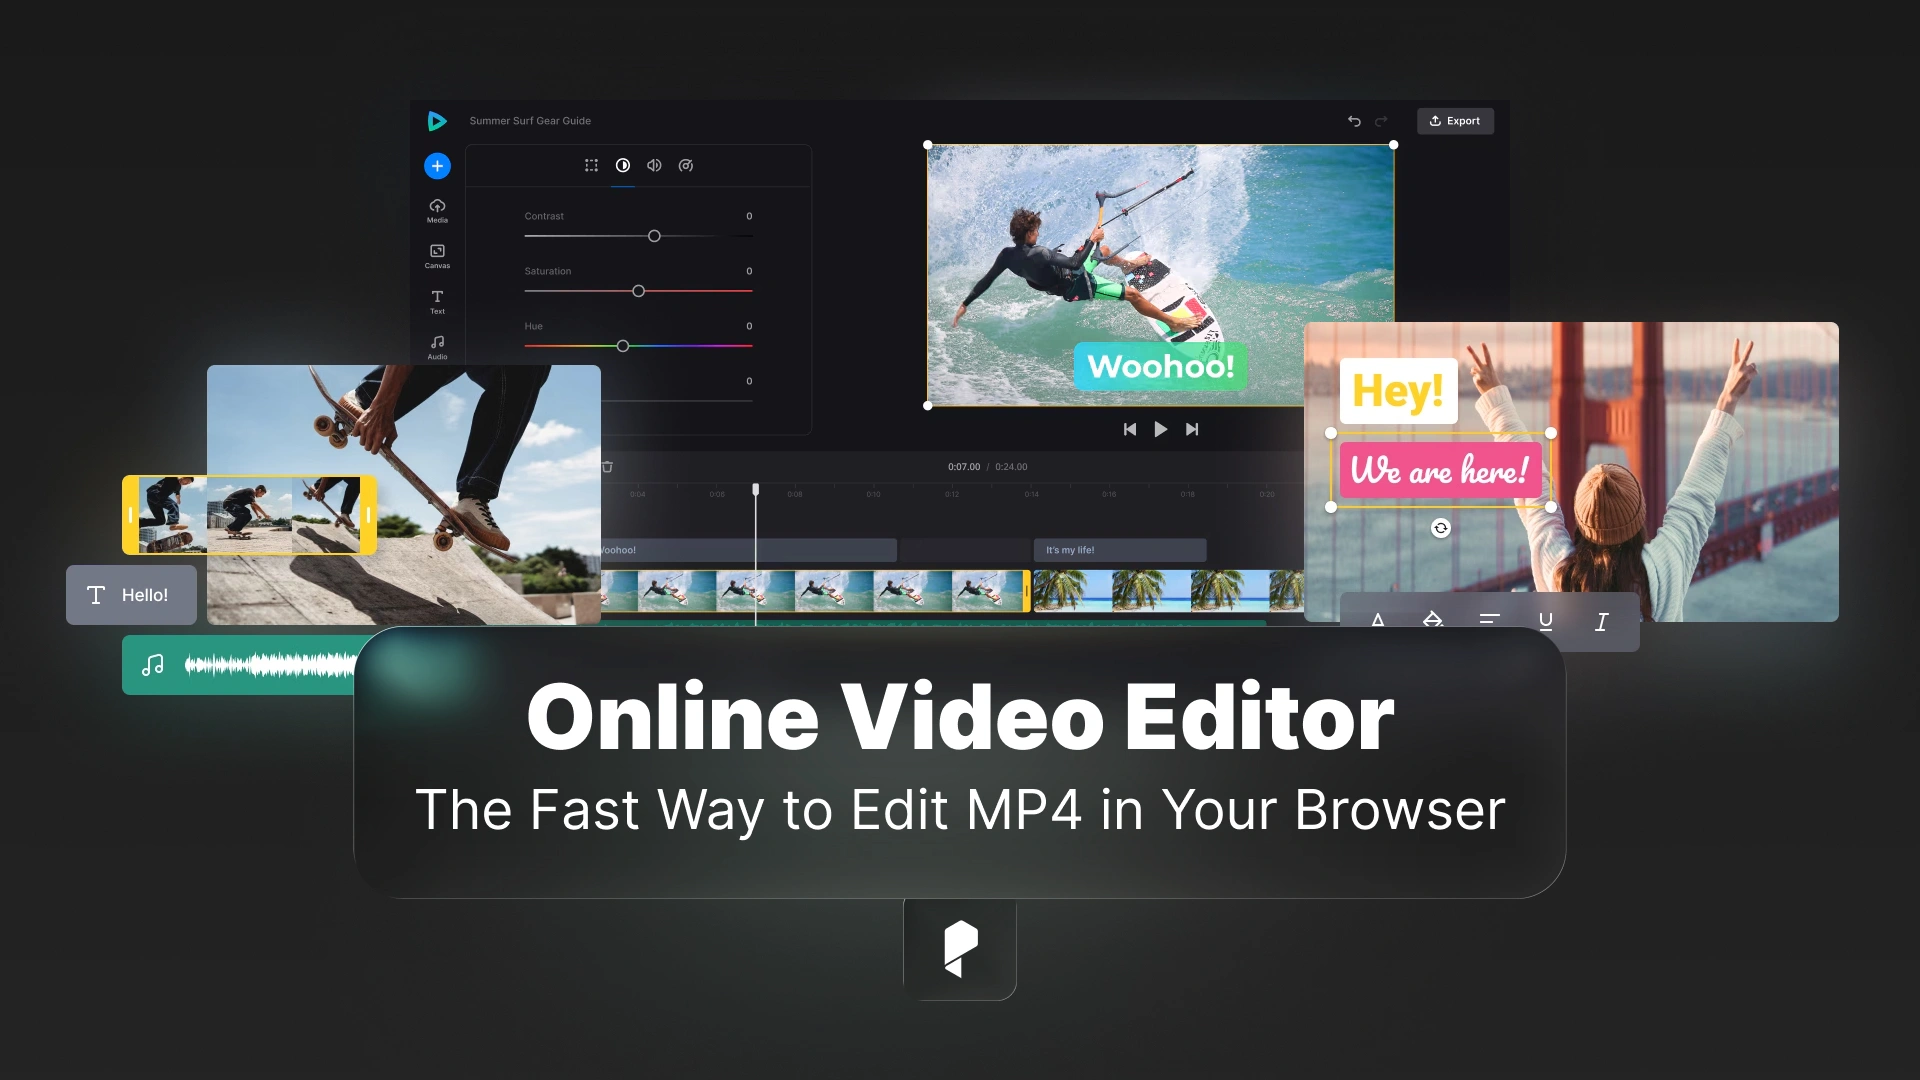
Online Video Editor, The Fast Way to Edit MP4 in Your Browser (Without Losing Your Mind)
31 Dec,2025
Tips & Tricks
9 Minutes
Top Features That Define Premium WordPress Hosting
31 Dec,2025
Tips & Tricks
9 Minutes
The Micro-Story Hack: How Animated Photos Turn Curiosity Into Clicks Before The Big Reveal
01 Jan,2026
Tips & Tricks
4 Minutes
The Complete Guide to Lighting Setup for Home Studio Video Production
18 Dec,2025
Tips & Tricks
9 Minutes
The Complete Guide to Storage Options for Video Creators in 2025
18 Dec,2025
Tips & Tricks
9 Minutes
How to Make a Wedding Video That Clients Will Treasure Forever
17 Dec,2025
Tips & Tricks
9 Minutes
Load More Posts